To create a line chart, add a table with at least two columns. This first column defines the labels on the x-axis, all other columns contain the data for an additional line. Then add the options chart and type=line to the table's options.
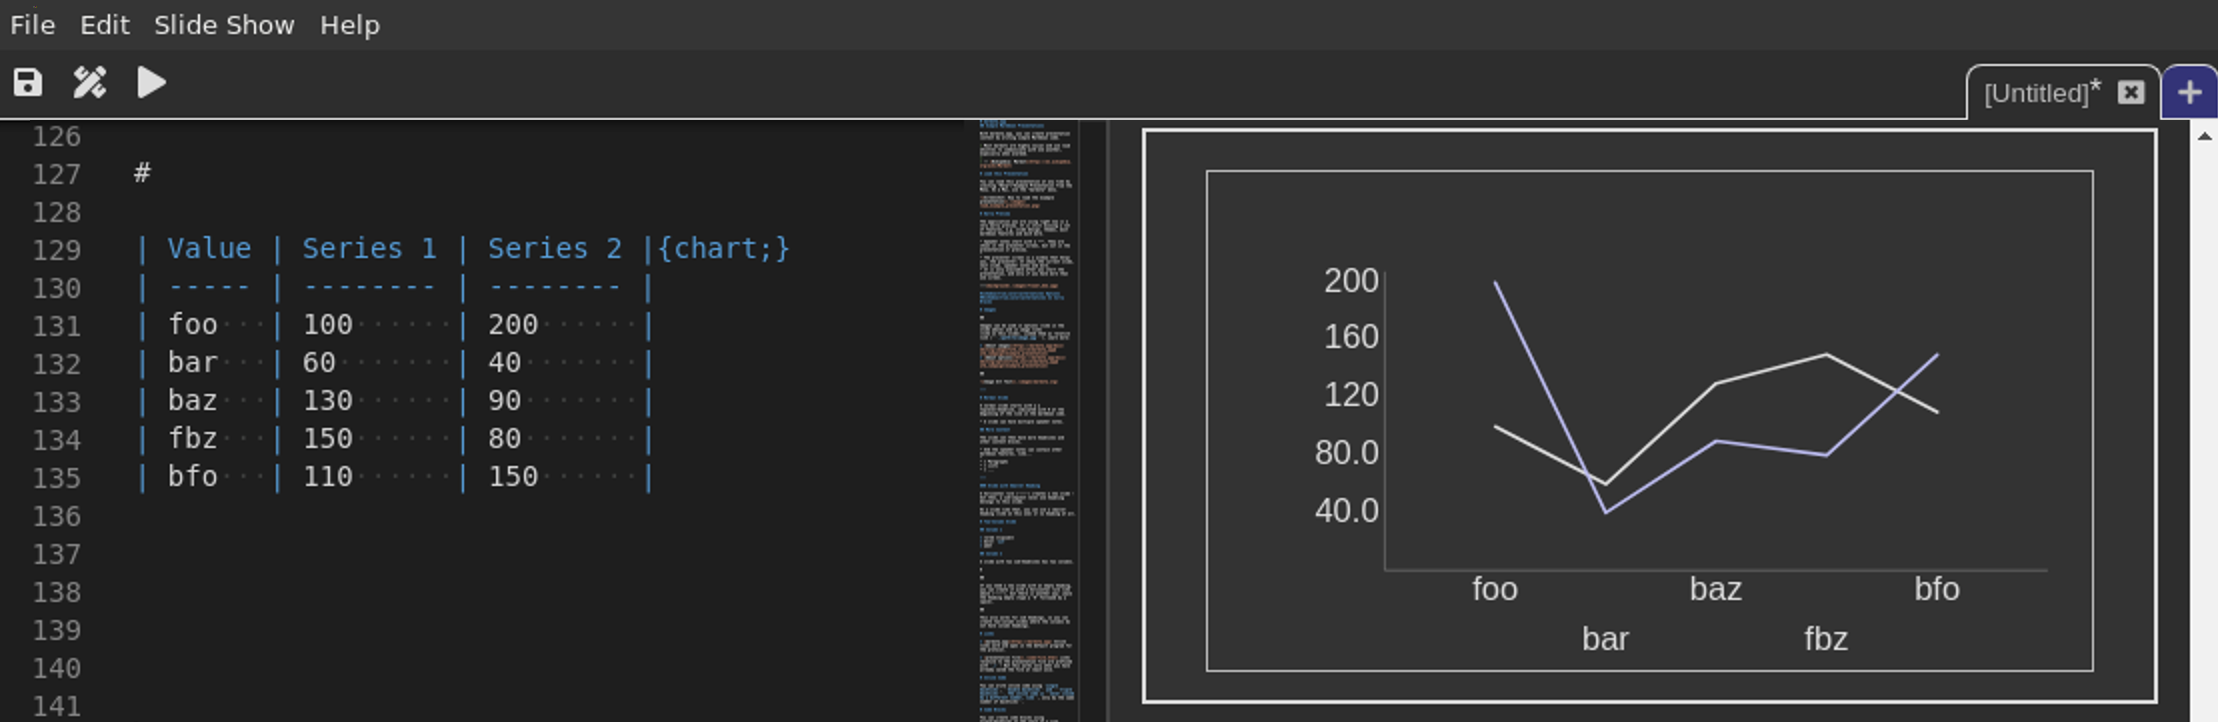
The table defining the chart data can have headings, like the table in the screen shot above, but it does not have to. The following table is a valid line chart definition:
| - | - | - |{chart;type=line}
| a | 1 | 2 |
| b | 3 | 4 |
Since line charts are the default chart type, even the next table is a valid line chart definition:
| - | - | - |{chart}
| a | 1 | 2 |
| b | 3 | 4 |
All charts support size options that allow you to fine-tune the layout of your presentation.